3.8 DGT Maintenance
3.8.1 Stopping and Restarting the Platform
Platform maintenance may require special actions to stop or restart the platform. The following steps are required to stop and then restart the platform:
Stop platform components. Navigate to the platform’s home directory (for example «cd DGT-Matagami/CORE»)
Stop one or more nodes of the cluster with the command:
bash stopDgtCluster.sh NumCluster NumNodehere: NumCluster - number of the cluster, NumNode - number of the node, ex. 1 1
Stop the Dashboard service if it was launched (see 3.5):
bash stopDgtDashboard.sh
Clear all the docker containers:
sudo docker container prune
Warning
In case of restarting the platform using the «bash upDgtCluster.sh» command after the service has been restarted, do not use the -G key to save the previous state (registry entries). If the node connects to an existing network, this option does not affect the state
3.8.2 Backing up Databases
In a certain way, any distributed blockchain-like system may be defined as a database that stores a certain state. Performing database backups is a normal system operation. However, distributed nature may make this operation less than efficient:
The operating platform is in constant registry synchronization mode. Therefore, the loss of data by one node does not affect the others. When the lost node is restored, it receives an updated portion of data.
Writing new data into the registry requires going through a consensus procedure (see 2.3), so that “offline” changes, conflicting data, and false entries will be rejected by the system’s nodes.
Despite these remarks, undergoing backup and then restoring the database may become useful in some special cases:
Testing and modelling of having the network switch between various initial data (tests on different initial states of the network)
Relaunching the network (hard fork) when all nodes agree to roll back to a certain state preceding the one they are in now
Preventative work for a private distributed network, when all nodes are moving to a new hardware platform, but it will be necessary to restore the current state.
To perform a database backup, follow the appropriate procedures:
Explore the platform’s physical storage architecture:
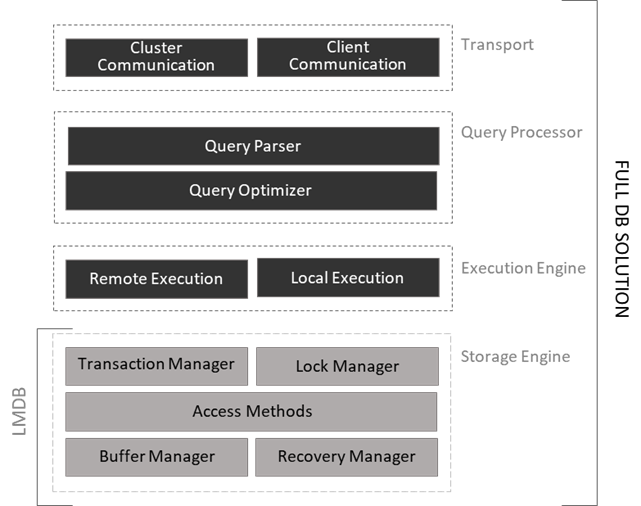
Master data is stored in the LMDB database which is a simplified NoSQL database (key-value store) based on the B-Tree [1]. The database provides significant speed through memory mapping. It is incorrect to compare this database with well-known relational databases or even large client-server solutions, since LMDB only implements a storage layer (scheme free) and does not use write-ahead transaction logs. Thus, LMDB does not have many additional mechanisms that allow you to run SQL queries or connect data through ODBC.
One of the advantages of using the LMDB is its lightness, speed, and efficient handling of blockages. The figure below presents the basic idea of how this solution compares to full storage implementations.
When initializing under Docker, the DGT platform creates a specialized catalog for storing files of the LMDB’s database in the «DGT-Matagami/dgt_clust/[Cluster_Num]/[Node_Num]/data» system directory, for instance «DGT-Matagami/dgt_clust/c1/dgt1/data». Basic data:
# |
LMDB File |
Description |
|---|---|---|
1 |
*-lock |
Files created by the system when accessing the database. In a normal situation, when the system is stopped, such files should not be present, however, they may remain during an unexpected server overload or incorrect shutdown |
2 |
block-0*.lmdb |
Main block storage, contains KV pair: block_id + block-information |
3 |
merkle-0*.lmdb |
Merkle tree storage that ensures state integrity (root hash/global state), also represented as a pair of KV. |
4 |
txn-receipts-0*.lmdb |
This database stores receipts for successfully accepted transactions, as well as other events associated with transactions |
5 |
pbft_consensus*.lmdb |
Database of votes in the process of reaching F-BFT consensus |
6 |
*.lmdb |
Other repositories related to application solutions |
Reserving data directly related to the platform core requires the correct saving of all specified data.
Receiving registry data in the form of a set of records does not require reservation procedures and can be performed through the API (see 4.1) in the form of uploading a list of transactions, batches, and / or blocks. The Dashboard component (see 3.5) also gives you the ability to view records interactively.
The backup procedure can be performed in the form of dumping (complete unloading of the relevant data with the possibility of its subsequent loading) or in the form of copying (saving) files of the database.
Here and below, the discussion will concern only cold backups that are performed in a stopped state. The hot backup procedure is not applicable to distributed systems such as blockchain.
Additional solution components, such as Grafana (see 3.8.4) may have their own databases, the back process of which is discussed in the individual component sections.
Warning
Some components, such as Oracles, may access data outside of the blockchain solution by keeping only references in the registry. It is not recommended to store confidential data, personal data, or data subject to the risk of attacks by quantum computers in the registry. These components and services may use their own secure copy and restore procedures.
To carry out further operations, stop the platform as described in 3.8.1 and reboot the server.
To perform dumping or current databases:
Install the LMDB utilities if you have not already done so:
sudo  apt update
sudo apt install lmdb-utils
Perform the following operation for each database [DB_NAME] in the «data» directory (DGT-Matagami/dgt_clust/c1/dgt1/data):
sudo mdb_dump -n /path/to/[DB_NAME] > /backup-path/to/[DB_NAME].dumpFor example,
The dump command from the «data» directory:
sudo mdb_dump -n merkle-01.lmdb > ~/merkle-01.lmdb.dump
To restore a database from a dump, run the following command, making sure the Docker services are stopped:
cd /path/to
mdb_load -n -f /backup-path/to/[DB_NAME].dump
Example:
Change to the “data” directory and run the following command:
sudo mdb_load -n -f ~/merkle-01.lmdb.dump merkle-01.lmdbTo copy a database while the Docker services are stopped:
Stop containers - see 3.8.1
Back up data files:
sudo cp -sparse-always /path/to/[DB_NAME] /backup-path/to/[DB_NAME].back
To restore the file, stop the containers and perform a reverse copy. Start the system according to instructions 3.2.2
3.8.3 Network Performance
The performance of distributed systems differs significantly from regular IT systems and depends on many factors:
The performance of the hardware that the node is running on.
The speed of the network hardware to which the nodes are connected.
Network volume (number of nodes), in case of distributing transactions over several nodes, the network may show greater performance than with one node.
The consensus mechanism used - the security and integrity of the registry is ensured by complex mechanisms (voting, such as in F-BT; mining, such as in PoW of Bitcoin, Ethereum).
Cryptography mechanisms that require additional computational procedures, possibly with GPU support.
Transactions to be executed (transactions that require significant processing may be much slower). Moreover, transactions that perform reading from a distributed ledger and transactions that provide writing (directly passing through the consensus procedure) have a significant difference.
Performance of the client software used to perform transactions, as well as its distributed nature and architecture.
These factors make it much more difficult to compare different systems with each other and render such indicators as absolute number of transactions per second as meaningless. Key performance metrics include:
Read Latency = [Time when response received - submit time] (time between sending a read request and receiving a response)
Read Throughput = [Total read operations / Total time in seconds] (throughput expressed in number of reads per unit of time)
Transaction Latency = [Confirmation Time| Network Threshold - Submit Time] (time between confirmation at the network threshold and sending the transaction). Since blockchain networks are asynchronous in nature, the response (check) to the transaction comes immediately, and confirmation that the transaction has been accepted and added to the corresponding block requires consensus time.
Transaction Throughput = [Total committed transactions/total time in second on committed nodes] (throughout of transactions, speed of acceptance and distribution of transactions throughout the blockchain). This speed is measured in TPS, the number of transactions per second.
When conducting test measurements, it is recommended to plan and record the performance test plan:
# |
Parameter |
Value [2] |
Description |
|---|---|---|---|
1 |
Name of the test |
Arbitrary short test name |
|
2 |
Planned or actual testing start and end dates |
The timing of testing allows you to evaluate the duration of tests and the time between failures |
|
3 |
Testing objectives [3] |
The testing objective informs its strategy ahead of time |
|
4 |
DGT version |
Record the version that you tested |
|
5 |
Transaction family |
Different transaction systems have varying load |
|
6 |
Network model |
Record the topology used, including the number of nodes and their distribution across clusters |
|
7 |
Geographic distribution of nodes |
Nodes that are located remotely bring additional costs and network effects to the network |
|
8 |
Test script |
The number of transactions, series, workload, and observed points (nodes) |
|
9 |
Test toolkit |
Throughout the testing process, keep an accurate protocol in which, for each scenario, you record the collected metrics, successful and unsuccessful runs, errors, and other information.
The main recommendations for choosing the tools and testing method are as follows:
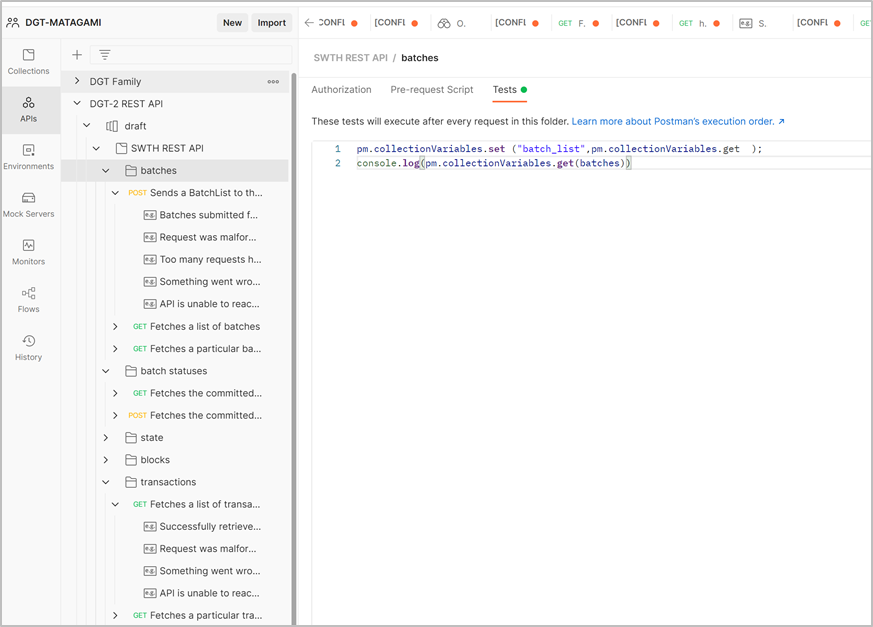
Preference should be given to instruments that can interact with the API. JMeter or Postman are recommended as such tools.
Run a series of tests measuring Latency and Throughput. Use averaging functions for measured metrics.
Save automated tests and attach them to test protocols.
When making comparisons, be guided by well-known testing frameworks for distributed systems (for example, Hyperledger Caliper)
3.8.4 Log & Monitoring
Each node has several services, each of which outputs information to Log files. After installing a node in the home directory of the platform (for example, DGT-Matagami), a «dgt_clust» directory appears, in which the working files of the corresponding node are stored. Each cluster and each node have their own working directory with an internal logs catalog, for example, « …/DGT-Matagami/dgt_clust/c1/dgt1/logs»:

If necessary, you can also connect an additional monitoring component based on Grafana/InfluxDb. The monitoring system extracts the information available to a node [4]. To install it:
Go to the Grafana service initialization directory «…/DGT-Matagami/CORE/etc/Grafana» and make the necessary settings in «grafana.ini», such as user and password settings (use admin/admin by default)
Prior to installing and connecting a node (see 3.2), build and launch the Grafana service:
bash upDgtGrafana.shRun a node with an additional =IDB key:
bash upDgtCluster.sh -G -SC -IDB -CB openssl 1 1Go to GRAFANA service (default port 3000)
🌐 http://[SERVER_IP]:3000A typical output is shown in the figure below:

Grafana service uses the InfluxDB located in the «DGT-Matagami/Grafana/Grafana.db» directory. Database backup and restore is described in the InfluxDB system manual.
Footnotes